Isometric infographics for Blackstone
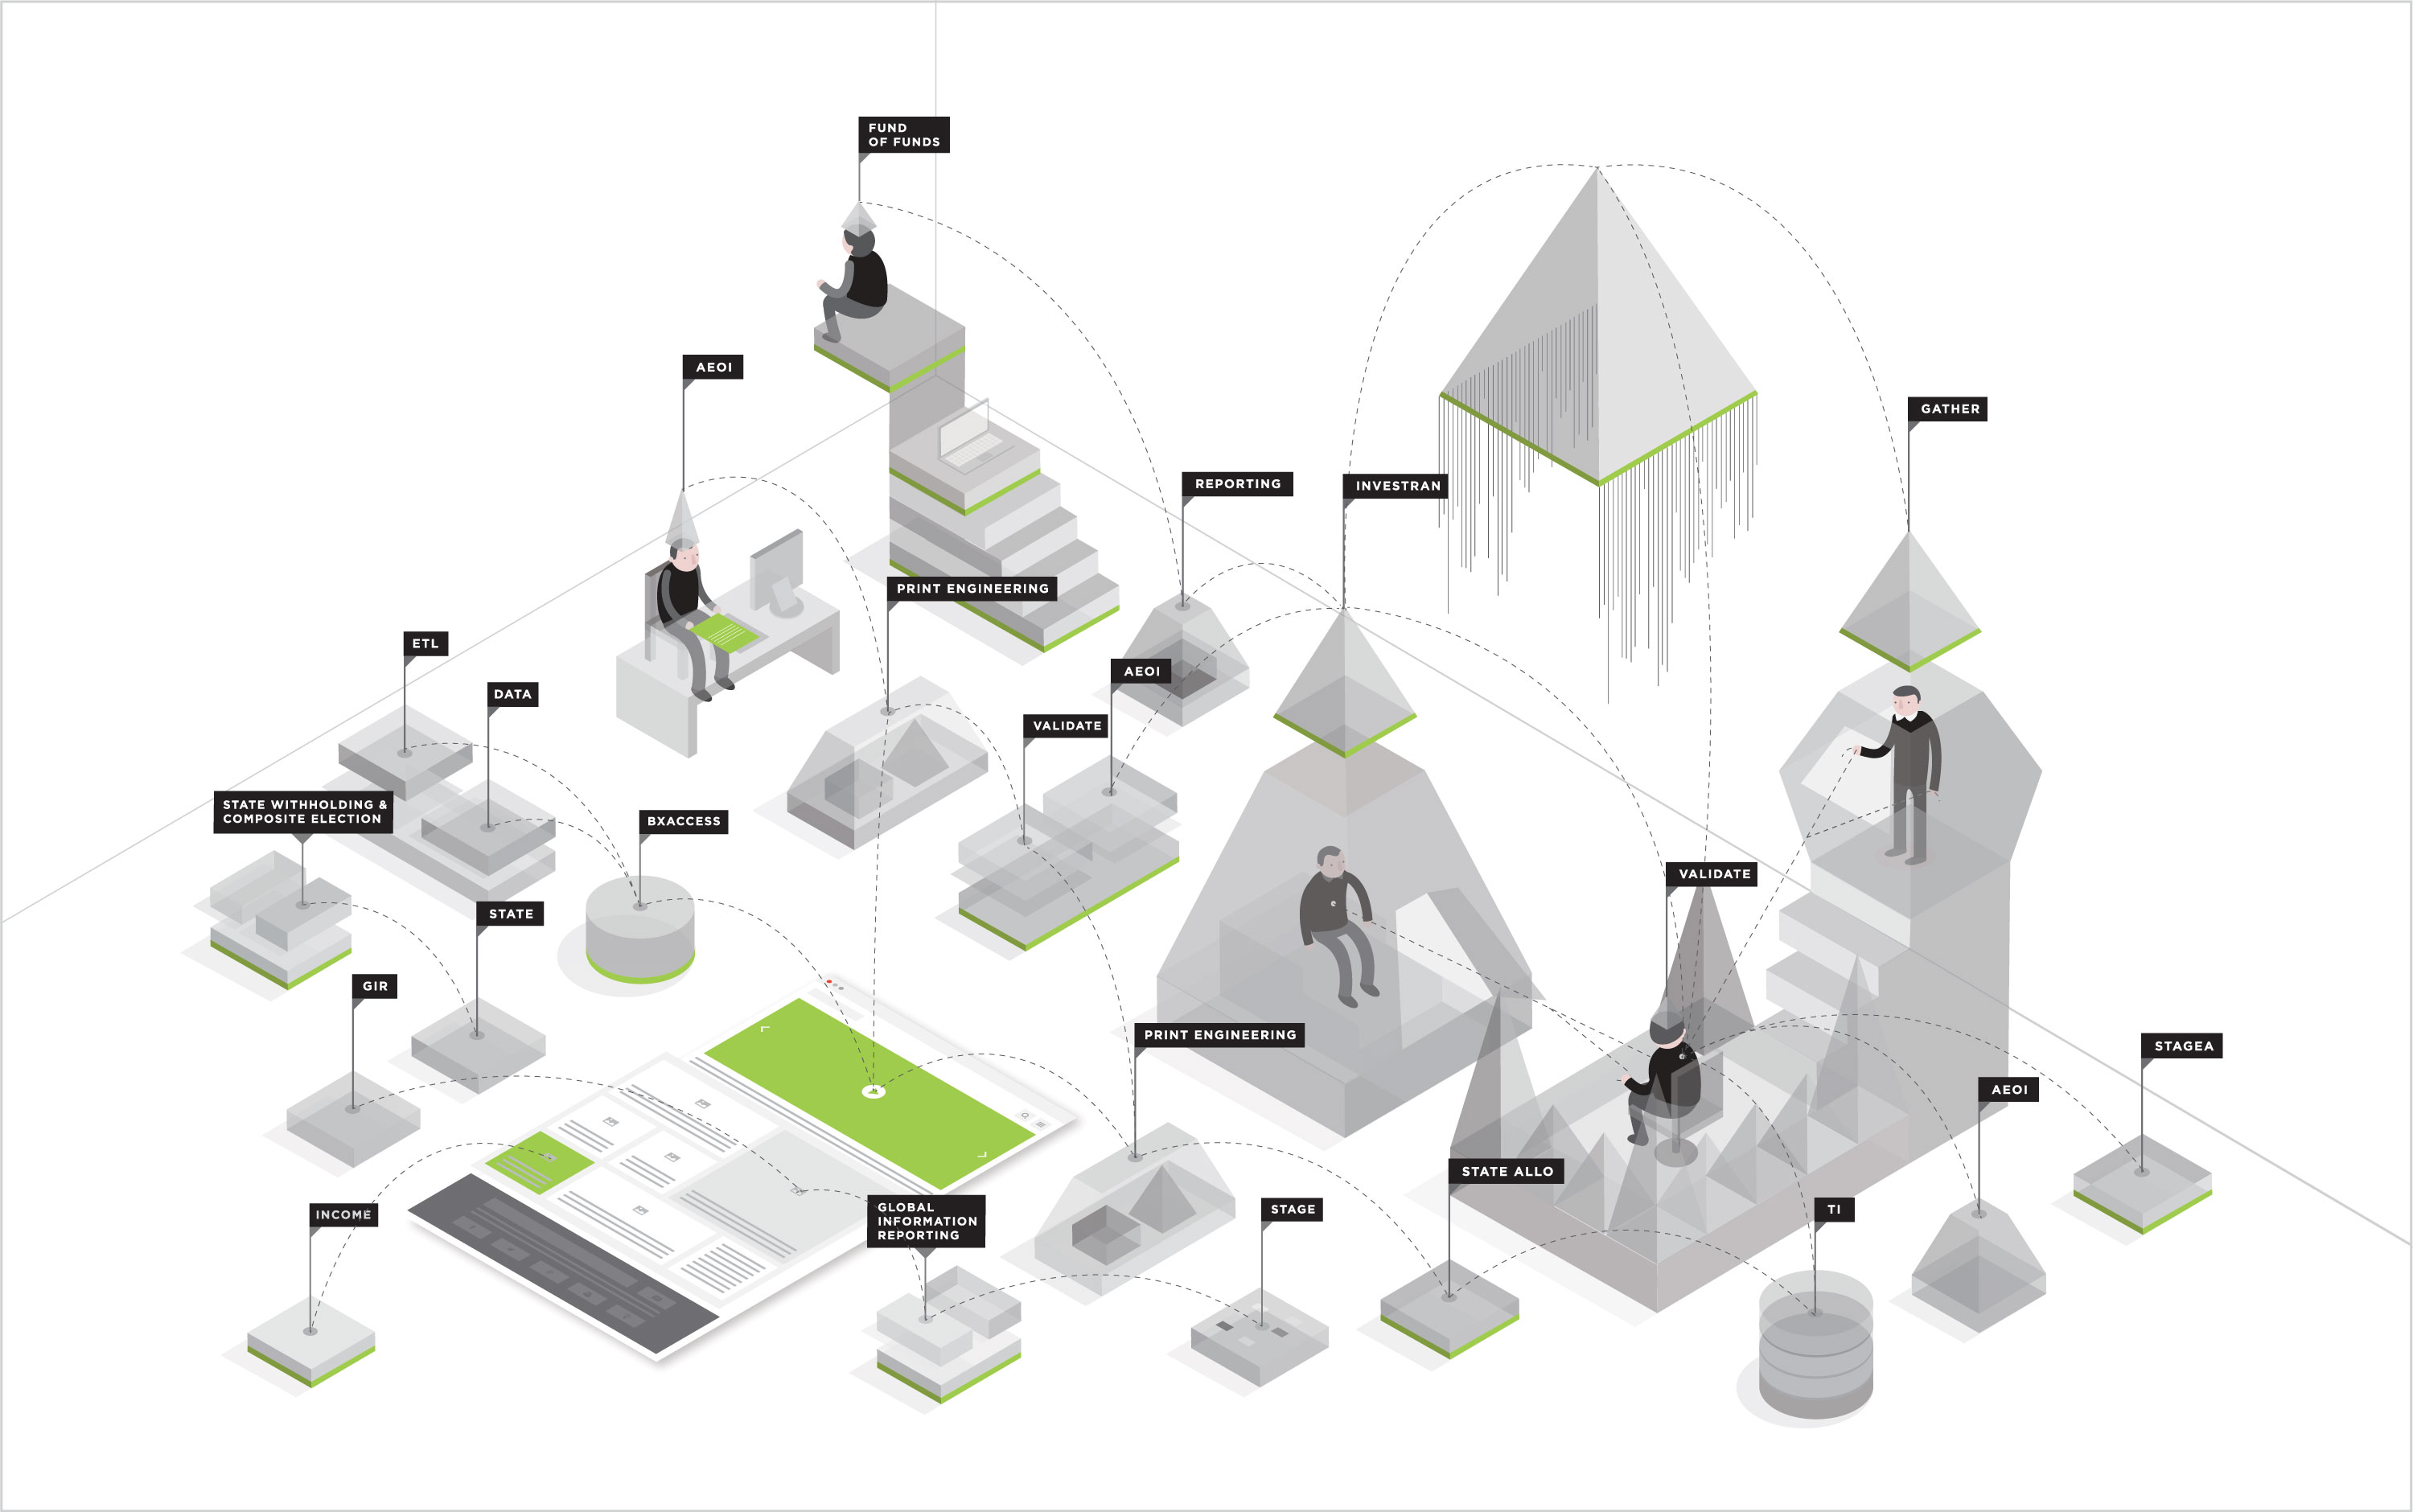
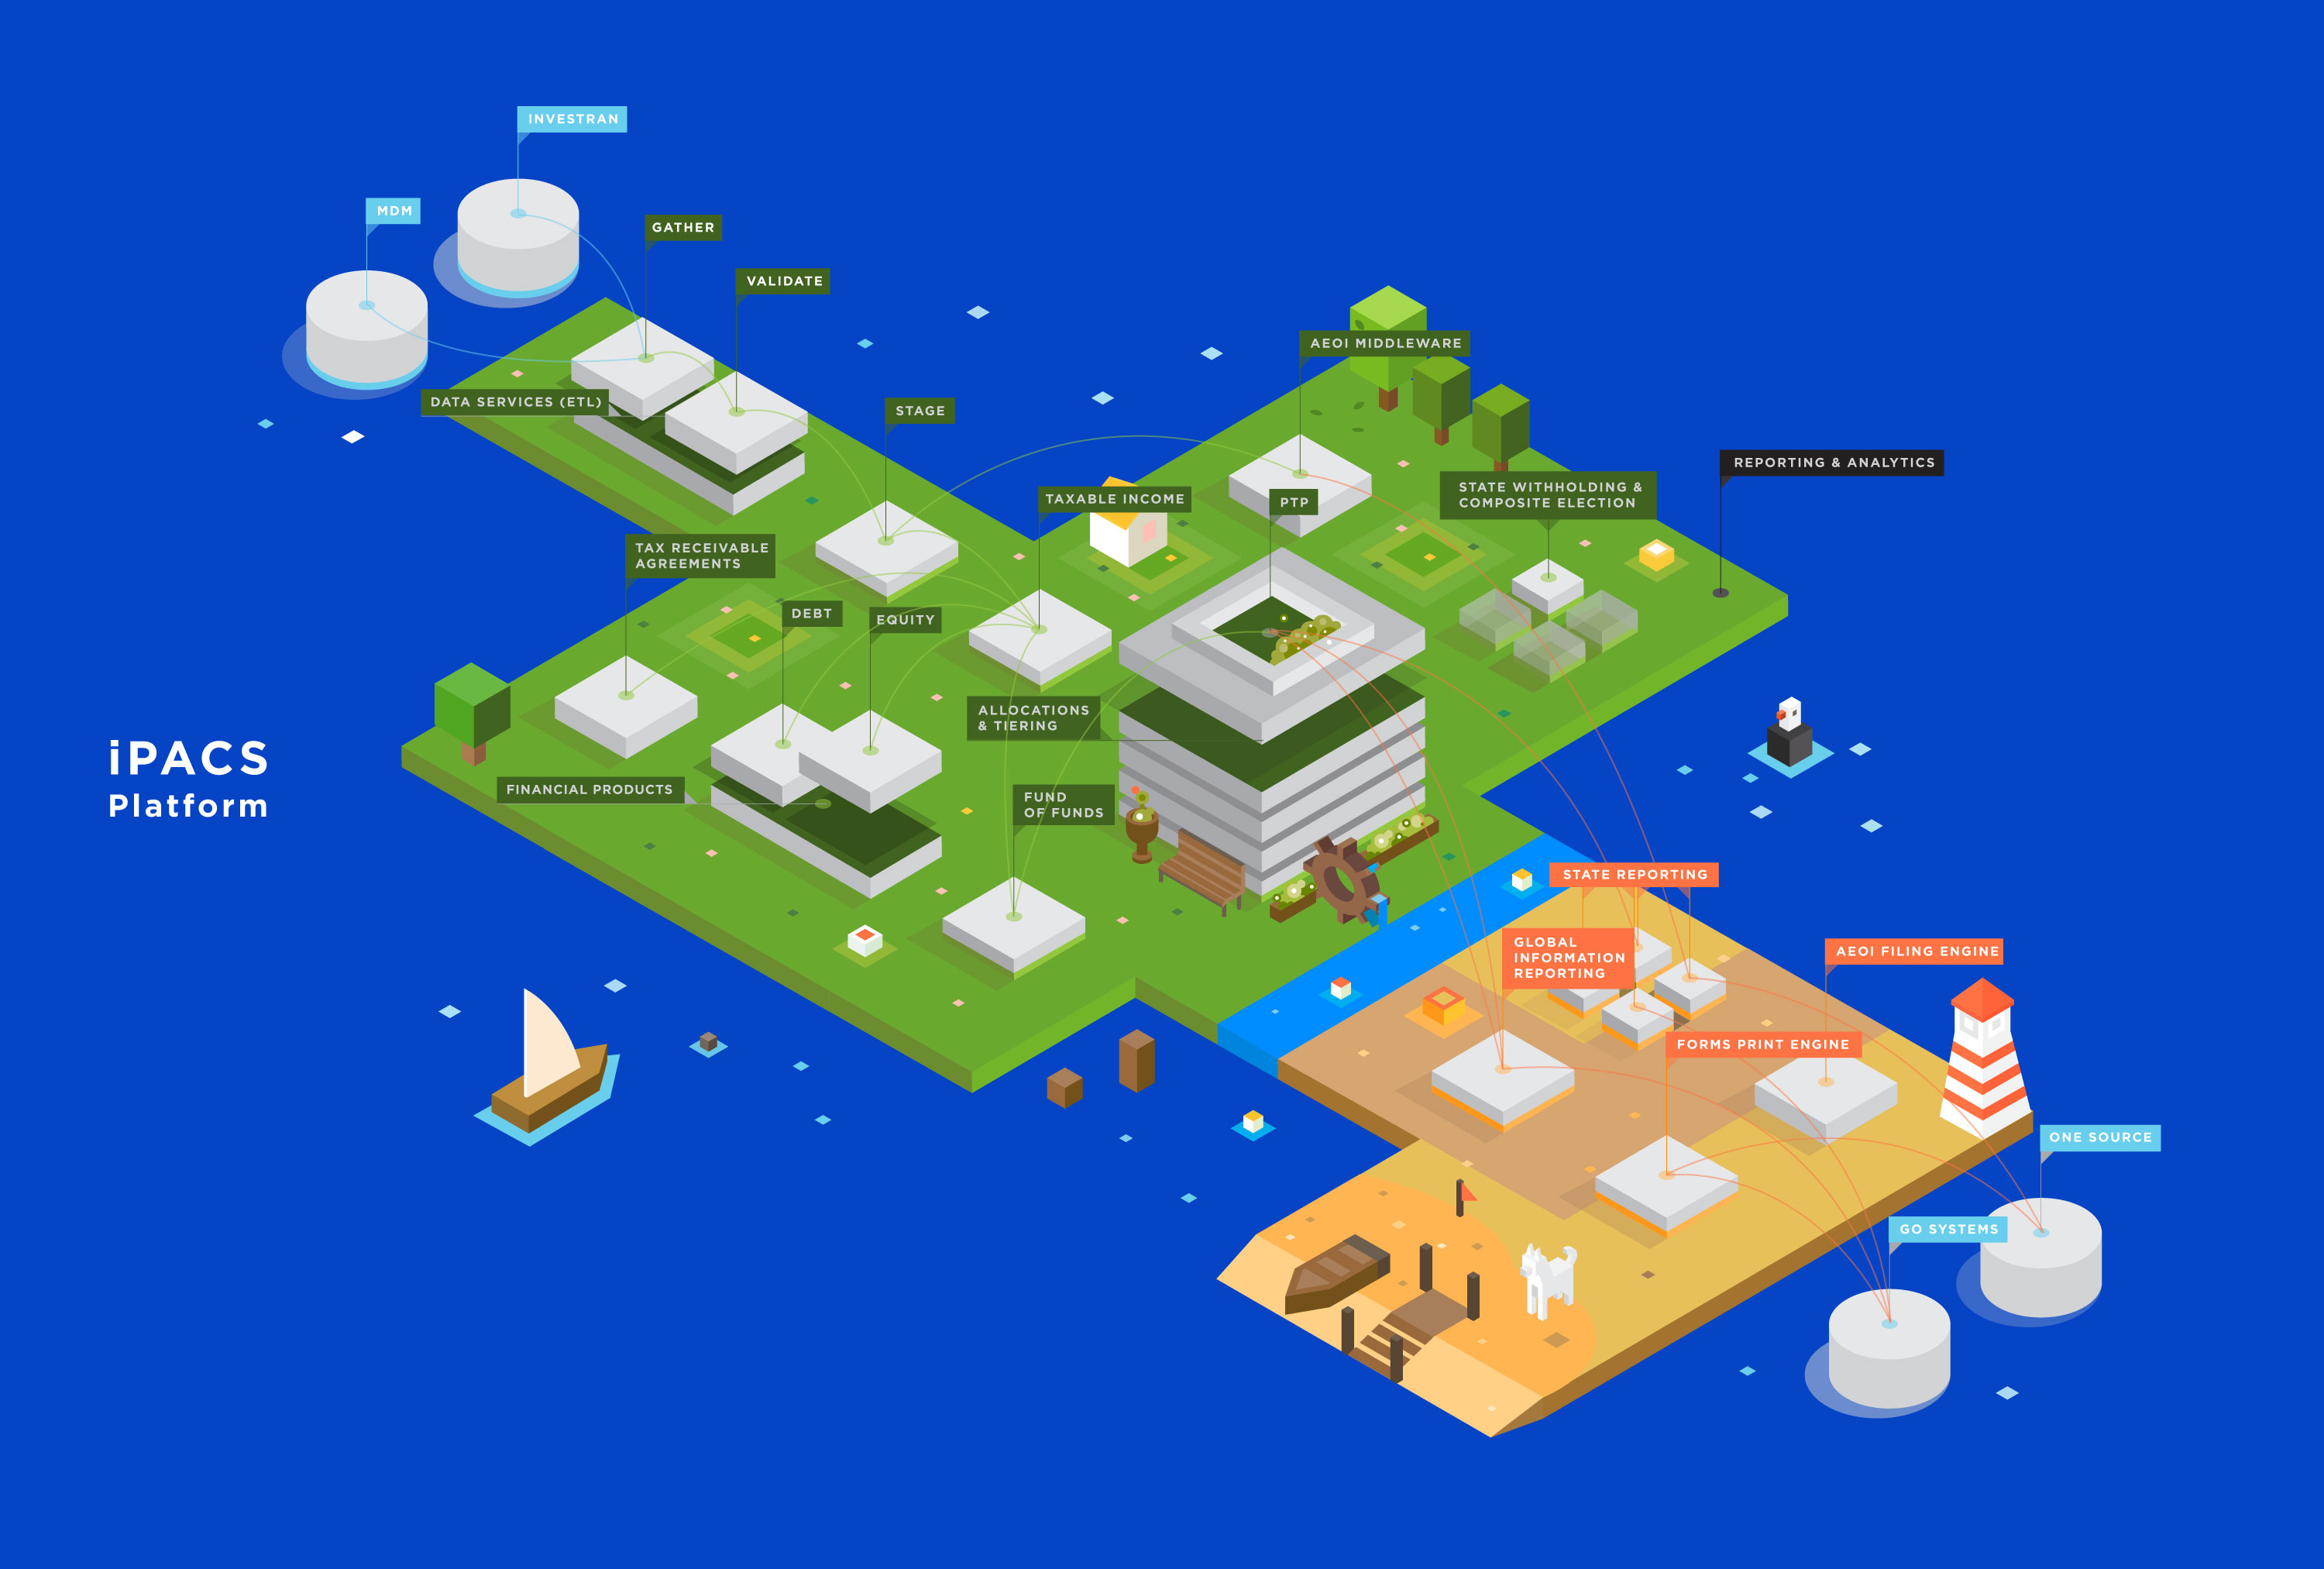
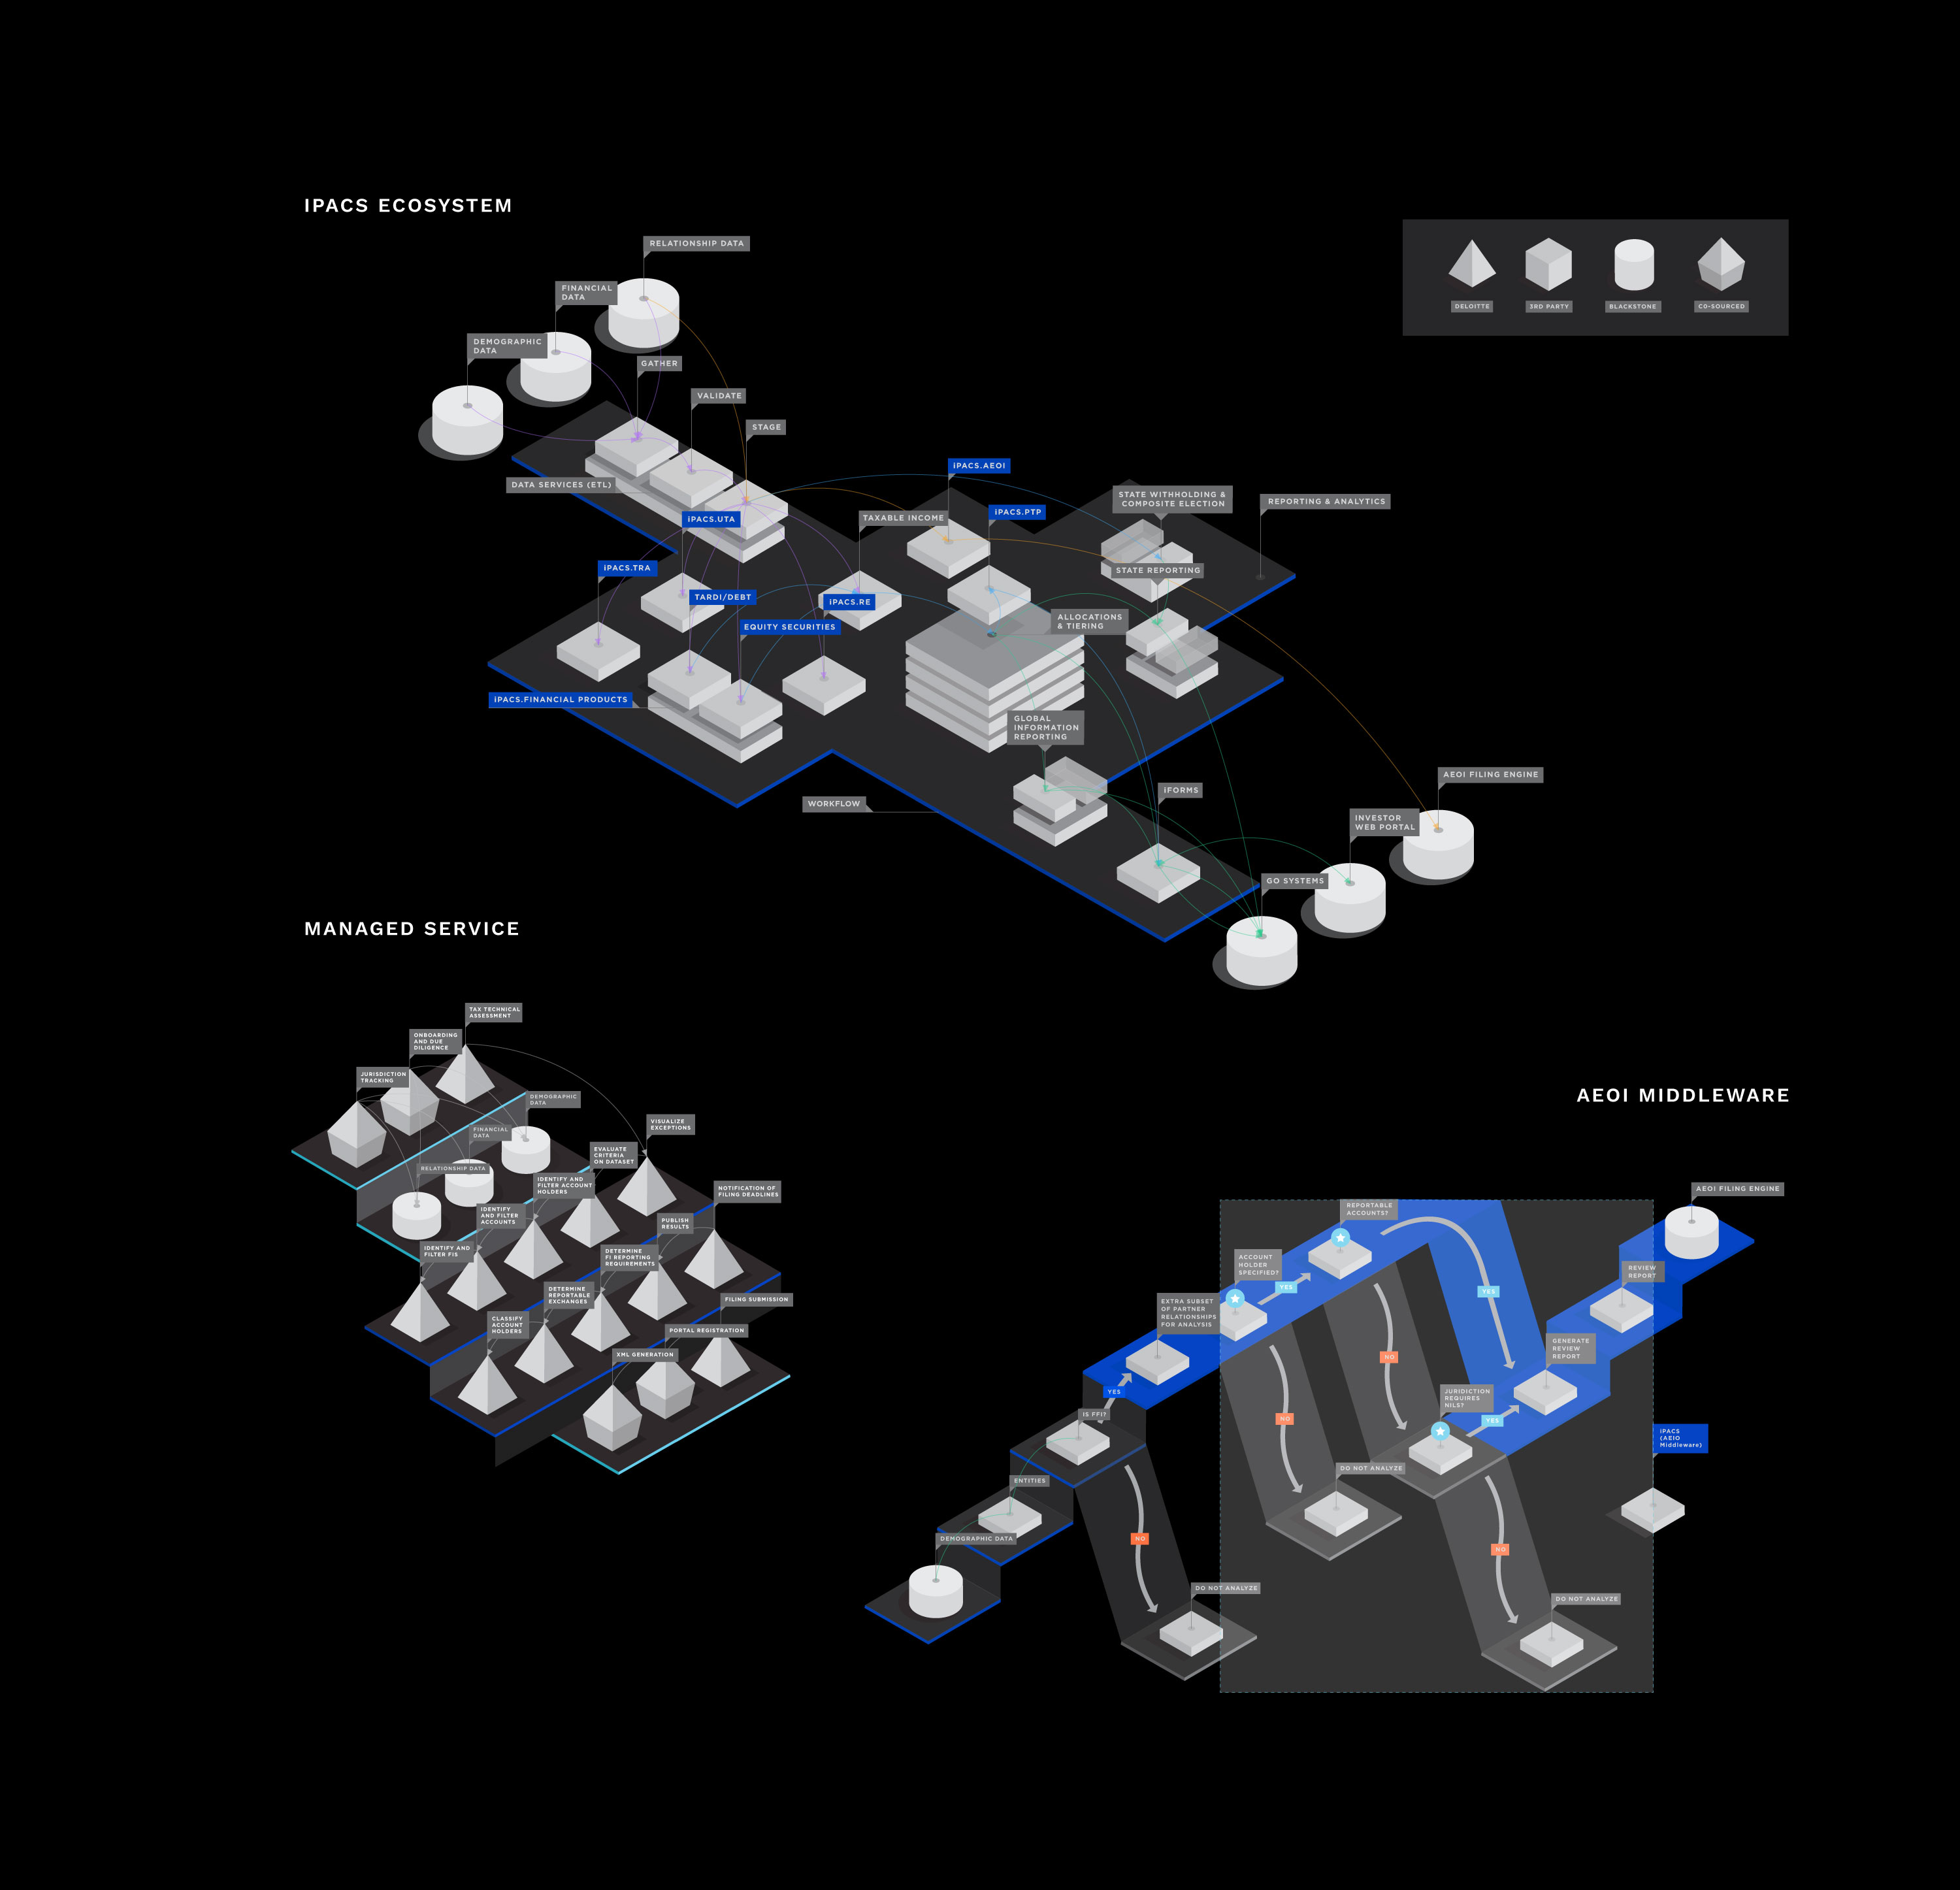
iPACS ecosystem data visualization is a full color illustrated project for Blackstone, and it shows the process of TRA services. The purpose was to realize a colorful and impactful project using an isometric perspective and a reliable system based on synthesis. The data visualization makes use of vibrant color and iconography to depict critical elements.
Disciplined
Illustration
Graphic Design
Role
Visual Interaction Designer
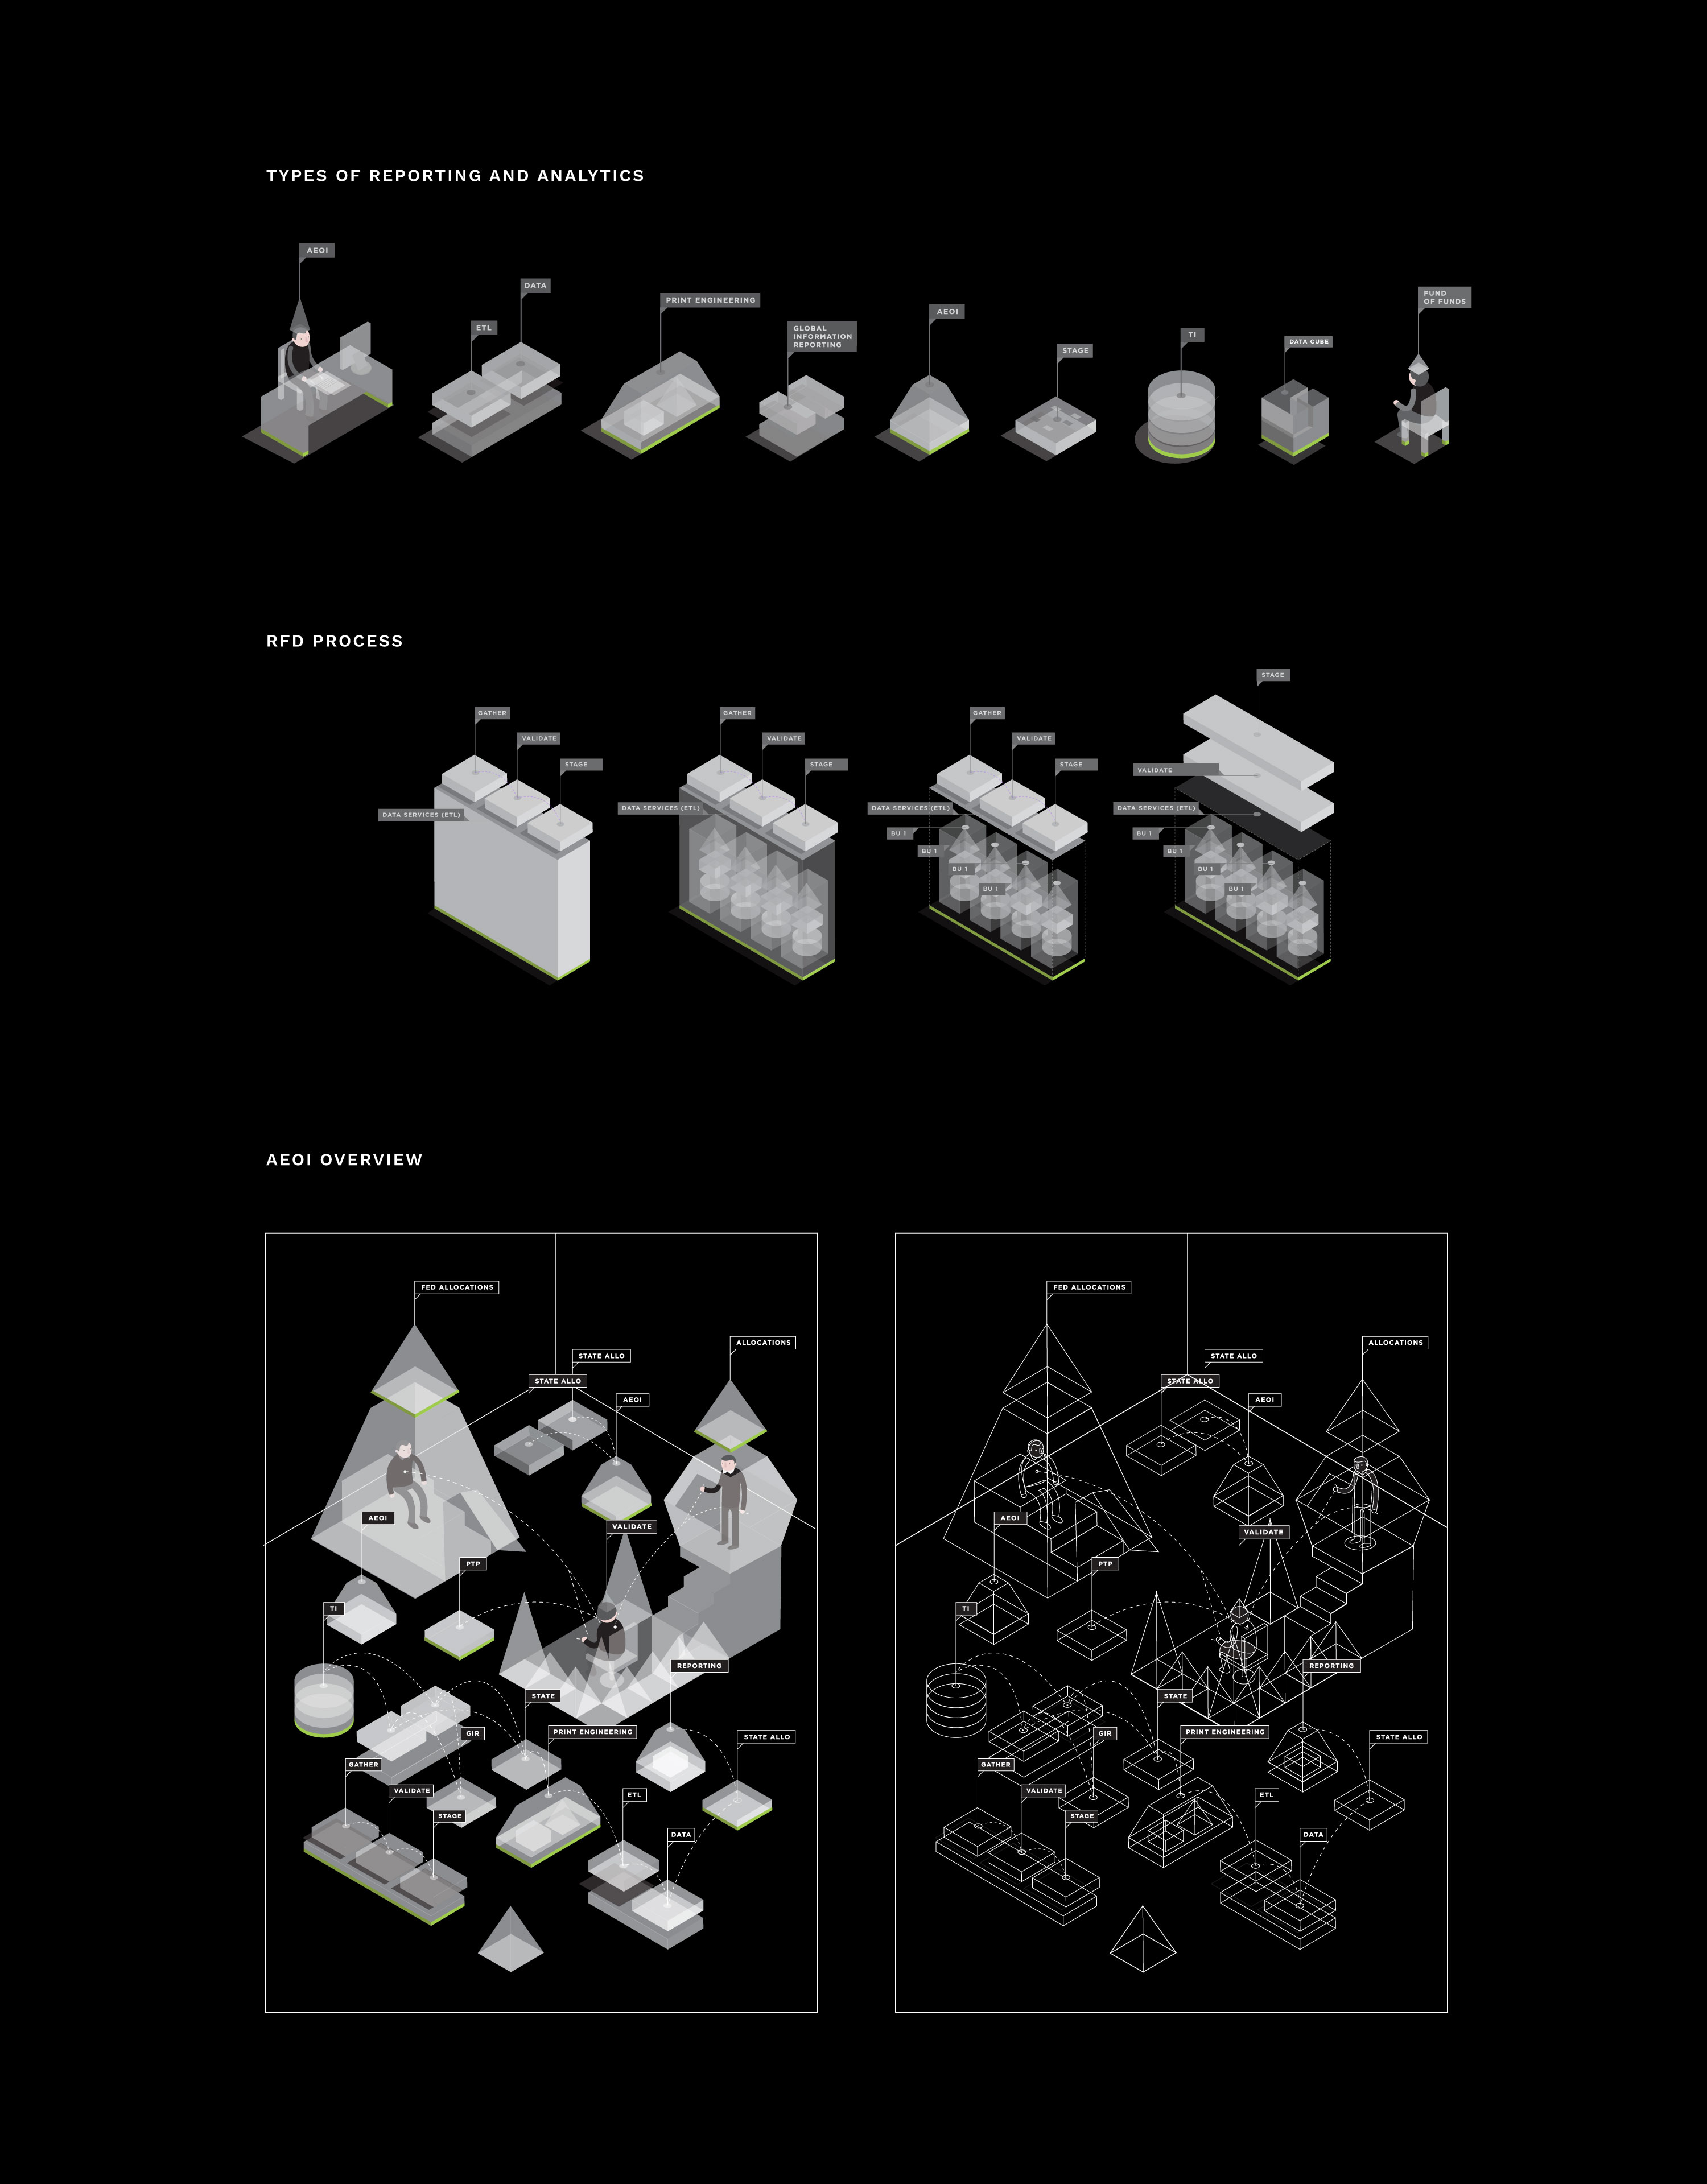
The goal was to represent the iPACS ecosystem with a colorful illustration and create a contemporary data visualization with a strong aesthetic—the iconography carefully designed with consideration of layout, visual hierarchies, type, and colors.
About TRA process
Phase 1: Design
We will collaboratively establish client service needs, understand your information flow, determine timing and milestones, and analyze the need for use of technology in the provision of services.
Phase 2: Customization
We will customize our process and service based on your specifications.
Phase 3: Review
We will work with your organization to review results using your historical information and fact patterns.
Phase 4: Release
Final delivery of work product and continued services with respect to annual compliance and/or consultation. This phase may also include discussions with business leader with respect to decisions to be made.